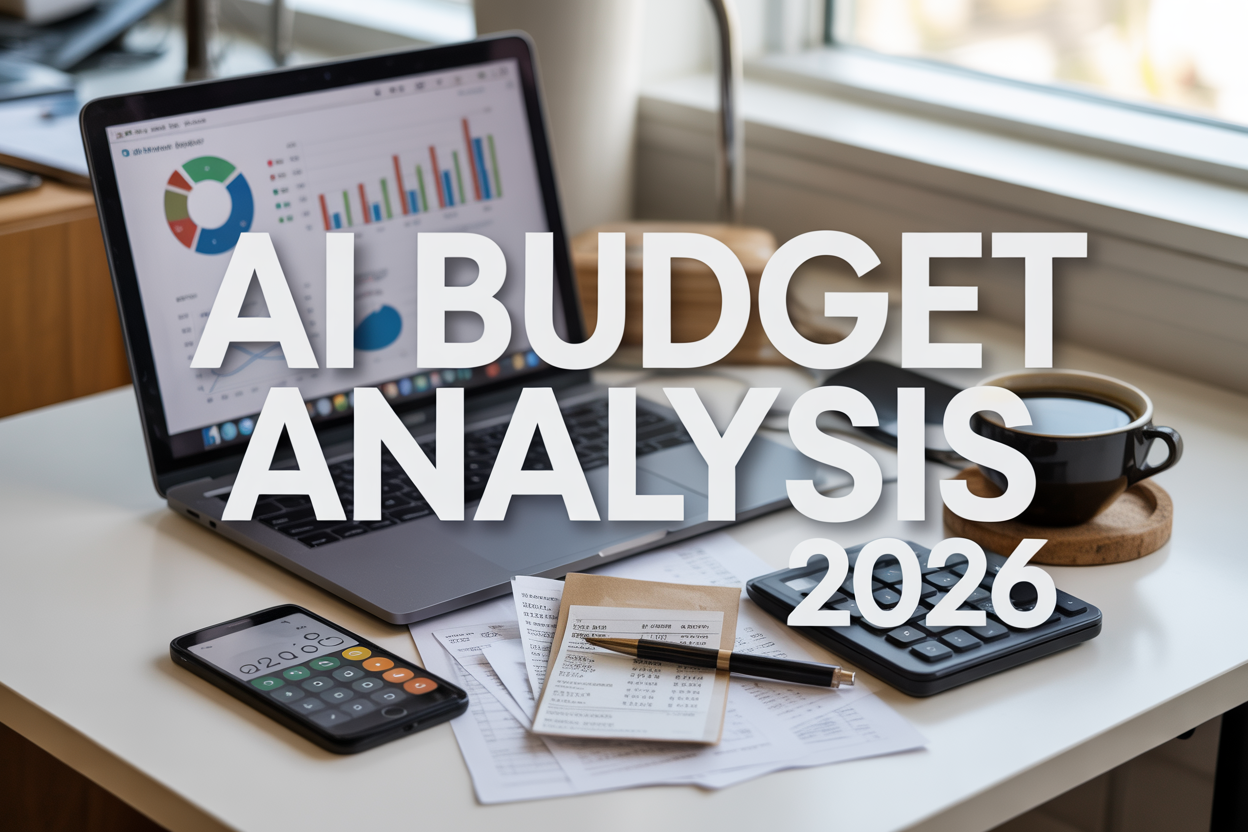
Planning your 2026 budget doesn’t have to feel like throwing darts in the dark. If you’re tired of creating budgets that fall apart by February, this free AI tool that instantly analyzes your last 3 months of spending will change how you approach your finances forever.
This guide is for busy professionals, small business owners, and anyone who wants to stop making financial decisions based on guesswork. You’ll discover why your old budgeting methods keep failing you and how to turn your messy spending data into clear, actionable insights. We’ll walk you through using this powerful AI budget analysis tool step-by-step, then show you how to decode your results and build a rock-solid 2026 budget that actually works with your real spending patterns.
Why Traditional Budgeting Methods Fail You Every Time

The Guesswork Trap That Drains Your Savings
Most people treat budgeting like throwing darts blindfolded. They pull numbers out of thin air, estimate their grocery spending based on good intentions, and set entertainment budgets that bear zero resemblance to their actual habits. This guessing game creates a dangerous cycle: you consistently overspend because your budget was fictional from the start, then feel guilty and try to “be better next month.” The problem isn’t your willpower—it’s that you’re building your financial plan on quicksand.
When you guess your spending categories, you’re essentially planning to fail. Your brain tricks you into believing you’ll suddenly become a different person who spends $200 on groceries instead of $350, or that you’ll magically stop those $5 coffee runs that add up to $100 monthly. This optimistic forecasting leaves massive gaps between your imaginary budget and reality, gaps that get filled with credit card debt and financial stress.
The guesswork trap also creates what financial experts call “budget fatigue”—you abandon your plan within weeks because it’s completely divorced from your actual lifestyle. Real budgeting requires real data, not wishful thinking.
How Emotional Spending Sabotages Your Financial Plans
Traditional budgets ignore the elephant in the room: emotions drive most spending decisions. You don’t buy that expensive gadget because it fits your budget—you buy it because you had a stressful week, received good news, or saw it on sale and felt FOMO kicking in. Standard budgeting approaches treat you like a robot that makes purely logical financial choices, completely missing how feelings influence your wallet.
Emotional spending follows predictable patterns that most budgets never account for. Stress spending typically happens on weekdays between 2-6 PM when energy levels crash. Celebration spending clusters around paydays, weekends, and after positive life events. Boredom spending peaks during long stretches at home or during repetitive daily routines. Social spending explodes when friends suggest activities that weren’t planned for.
Your traditional budget might allocate $100 for “miscellaneous” spending, but emotional triggers can easily push that to $300 in a single week. Without understanding when and why you spend emotionally, you’re setting yourself up for constant budget failures. The guilt from these failures often triggers more emotional spending, creating a vicious cycle that destroys financial confidence.
Why Annual Budgets Ignore Your Real Spending Patterns
Annual budgets assume your spending stays consistent across twelve months, which couldn’t be further from reality. Your actual spending fluctuates dramatically based on seasons, life events, work schedules, and changing priorities. January might be your lowest spending month due to New Year’s resolutions, while December explodes with holiday expenses. Summer brings vacation costs, while winter increases utility bills and comfort purchases.
Most people also experience what behavioral economists call “spending seasonality”—predictable increases and decreases throughout the year that traditional budgets completely ignore. Back-to-school season hits even adults without children due to sales and the psychological urge to “refresh” everything. Tax season creates either splurge months (refunds) or tight months (owing money). Work busy seasons often increase spending on convenience items and stress relief.
Your spending also evolves throughout the year as priorities shift. What seemed important in January might be irrelevant by June. New hobbies emerge, old subscriptions get forgotten, and lifestyle changes happen gradually. Annual budgets become outdated within months, leaving you with a financial plan that no longer matches your actual life.
The three-month analysis approach captures these real patterns instead of forcing you into arbitrary annual categories that don’t reflect how you actually live and spend.
Transform Your Financial Data Into Actionable Intelligence

Extract Meaningful Patterns from Transaction Chaos
Raw transaction data looks like digital noise – random amounts, cryptic merchant names, and scattered dates that mean nothing on their own. The magic happens when AI starts connecting the dots. Your morning $4.75 coffee purchase suddenly becomes part of a $95 weekly pattern. That $67 Amazon charge links to twelve similar purchases, revealing a $800 monthly online shopping habit you never noticed.
AI tools excel at grouping similar transactions across different merchants. Your grocery spending might be split between Target, Walmart, local markets, and that corner store you hit for emergency milk runs. Manually tracking these would take hours, but AI instantly consolidates them into clear categories. The same goes for entertainment expenses scattered across Netflix, movie tickets, concert venues, and streaming services.
Time-based patterns emerge that your brain simply can’t process from looking at bank statements. Maybe you spend 40% more on weekends. Perhaps your restaurant expenses spike every third week when you’re swamped with work. AI spots these rhythms instantly, turning chaotic data into clear spending stories.
Identify Hidden Spending Leaks in Seconds
Small recurring charges are budget vampires – they drain your account slowly enough that you barely notice. AI instantly flags subscriptions you forgot about: that $9.99 meditation app from January, the $15 photo storage service you used once, or the gym membership that’s been charging you for six months after you stopped going.
Duplicate charges become obvious when AI compares transaction amounts and dates. Maybe your phone bill got charged twice in October, or that hotel reservation hit your card multiple times during booking glitches. These errors cost the average person $200+ annually, according to banking studies.
Geographic spending anomalies jump out immediately. AI spots when you’re paying premium prices for the same items in different locations. Your usual $12 lunch spot versus that $18 place near your dentist’s office – patterns that reveal where your money goes further and where you’re paying convenience taxes.
Fee analysis reveals hidden costs eating your budget. ATM fees, overdraft charges, foreign transaction fees, and service charges add up quickly. AI calculates exactly how much these “small” fees cost you monthly, often revealing shocking totals that motivate immediate banking habit changes.
Spot Seasonal Trends That Impact Your Budget
Holiday spending creates predictable budget storms that catch people off-guard every year. AI analyzes your December spending patterns and projects forward, showing exactly how much extra cash you’ll need for gifts, travel, and celebrations. No more January credit card surprises.
Summer expenses follow distinct patterns – higher utility bills from air conditioning, vacation spending, kids’ camp fees, and outdoor activity costs. AI tracks these seasonal fluctuations across multiple years, calculating your typical summer budget increase down to the dollar.
Back-to-school seasons trigger spending spikes even for adults without kids – clothing sales, office supply runs, and renewed gym memberships as everyone gets back into routine. AI identifies these patterns and helps you budget for predictable seasonal behavior changes.
Weather-driven spending varies by location but follows clear patterns. Heating bills, snow removal services, or hurricane preparation costs all create budget impacts. AI learns your local seasonal spending patterns and builds them into forward-looking budgets.
Calculate Your True Monthly Baseline Expenses
Fixed expenses seem straightforward until you dig deeper. Your mortgage stays constant, but property taxes, insurance, and HOA fees might be paid quarterly or annually. AI calculates the true monthly cost by averaging these irregular payments, giving you accurate baseline numbers.
Variable necessities like utilities, gas, and groceries fluctuate monthly but follow patterns. AI analyzes three months of data to establish realistic ranges rather than using single-month snapshots that might be unusually high or low. Your true grocery baseline might be $420 monthly, not the $380 from last month when you were traveling.
Semi-fixed expenses create budget confusion – things like car maintenance, medical co-pays, or home repairs that happen irregularly but inevitably. AI calculates monthly reserves needed for these predictable unpredictables by analyzing your historical patterns.
Income irregularities get factored into baseline calculations. Freelancers, commissioned sales people, and anyone with variable income needs baseline expenses calculated against their lowest typical monthly earnings, not their highest. AI identifies your income floor and builds sustainable baselines around guaranteed monthly minimums.
Master the Free AI Budget Analysis Tool

Step-by-step setup for instant results
Setting up your AI budget analysis takes less than five minutes, and you’ll have actionable insights before your morning coffee gets cold. Start by creating your free account with a secure email address and strong password. The platform walks you through each step with simple prompts, so you won’t get lost in technical jargon.
Once you’re logged in, you’ll see a clean dashboard with three main options: manual upload, direct bank connection, or CSV import. Choose the method that feels most comfortable for your situation. The manual upload works perfectly if you prefer downloading statements from your bank’s website, while direct connection offers real-time syncing for ongoing analysis.
The initial setup wizard asks about your financial goals and spending priorities. These questions help the AI understand your unique situation – whether you’re saving for a house, paying off student loans, or planning a major purchase. Answer honestly because this context shapes how the tool interprets your spending patterns and generates recommendations.
Connect your accounts safely and securely
Bank-level encryption protects your financial data throughout the entire process. The platform uses 256-bit SSL encryption, the same security standard major financial institutions rely on. Your login credentials never get stored on their servers – instead, the system uses read-only access tokens that expire automatically.
Most major banks and credit card companies integrate seamlessly with the platform. You’ll find Chase, Bank of America, Wells Fargo, Capital One, and hundreds of smaller institutions on the supported list. Credit unions and online banks like Ally and Discover also connect without issues.
The connection process happens through Plaid or Yodlee, industry-standard financial data aggregators that power apps like Mint and Personal Capital. These companies have processed billions of transactions safely for over a decade. When you enter your banking credentials, they go directly to your bank’s secure servers – the AI tool never sees your actual login information.
Two-factor authentication adds another security layer for supported institutions. You’ll receive a text or email verification code during the initial connection, just like logging into your bank’s mobile app. This extra step prevents unauthorized access even if someone somehow obtained your banking information.
Generate comprehensive spending reports automatically
The AI engine processes your transaction history within minutes of connection, categorizing every purchase with remarkable accuracy. Fast food purchases, gas stations, grocery stores, and subscription services get sorted automatically into meaningful categories. The system recognizes recurring payments and identifies spending trends you might miss when reviewing statements manually.
Your comprehensive report includes visual spending breakdowns by category, month-to-month comparisons, and seasonal pattern analysis. The AI spots unusual spending spikes and identifies subscription services you might have forgotten about. Many users discover they’re paying for streaming services they haven’t used in months or gym memberships they completely forgot about.
Income analysis shows how your earnings fluctuate throughout the year, helping identify the best months for major purchases or aggressive saving. The tool tracks salary deposits, freelance payments, investment returns, and other income sources separately, giving you a complete financial picture.
The system generates alerts for concerning spending patterns – like credit card balances creeping upward or emergency fund depletion. These proactive warnings help you course-correct before small issues become major financial problems.
Customize categories for your lifestyle
Default categories work well for most people, but your financial life probably has unique aspects that deserve special attention. Pet owners might want separate categories for veterinary expenses, grooming, and pet supplies instead of lumping everything into “miscellaneous.” Freelancers benefit from tracking business expenses separately from personal spending, even when using the same credit card.
The customization interface lets you create new categories, merge existing ones, or split broad categories into specific subcategories. Parents often create separate categories for each child’s expenses, making tax season easier and helping track the true cost of raising kids. Homeowners frequently separate routine maintenance from major repairs and upgrades.
You can also set up custom rules for automatic categorization. If you regularly shop at Costco for both groceries and household items, you can create rules that split those transactions based on typical spending amounts or shopping patterns. The AI learns from your manual corrections and applies similar logic to future transactions.
Geographic customization helps if you travel frequently or live in multiple locations. You might want separate categories for home expenses versus vacation spending, or different rules for domestic versus international transactions. The system can automatically categorize expenses based on merchant location or transaction currency.
Decode Your Spending Analysis Results

Understanding Variable Versus Fixed Expense Ratios
Your AI analysis reveals the split between fixed and variable expenses, giving you crucial insight into your financial flexibility. Fixed expenses like rent, insurance, and loan payments typically consume 50-60% of income for most households, while variable expenses like groceries, entertainment, and shopping should ideally make up 20-30%.
When your variable expenses creep above 40% of income, you’re walking a financial tightrope. The AI tool flags this imbalance by comparing your ratios against millions of anonymized spending patterns. Look for categories where variable spending has grown disproportionately – dining out increasing from 8% to 15% of income signals a pattern worth addressing.
Your fixed-to-variable ratio also determines your financial resilience. High variable spending means you can quickly adjust during tough times, while excessive fixed costs lock you into obligations regardless of income changes. The sweet spot sits around 60% fixed, 30% variable, with 10% reserved for savings and unexpected expenses.
Recognizing Dangerous Spending Velocity Increases
Spending velocity measures how quickly your expenses accelerate month-over-month within specific categories. The AI identifies velocity spikes that often go unnoticed in traditional budgeting – like subscription services jumping 25% monthly or impulse purchases doubling every few weeks.
Watch for velocity patterns that compound over time. A 10% monthly increase in online shopping might seem manageable, but that trajectory leads to doubled spending within seven months. The analysis highlights these exponential curves before they devastate your budget.
| Velocity Range | Risk Level | Typical Categories |
|---|---|---|
| 0-5% monthly | Low | Groceries, utilities |
| 6-15% monthly | Moderate | Dining, entertainment |
| 16%+ monthly | High | Shopping, subscriptions |
Emergency velocity spikes during life changes – new job, relationship status, or health issues – often trigger permanent spending increases. The AI catches these inflection points and projects their long-term impact on your financial trajectory.
Benchmarking Your Habits Against Optimal Ranges
Your spending analysis includes percentile rankings across similar demographic and income groups. Discovering you’re in the 85th percentile for restaurant spending while sitting in the 20th percentile for emergency savings reveals priority misalignments.
Optimal spending ranges vary by income level, but universal benchmarks exist. Housing costs exceeding 30% of gross income create long-term wealth-building challenges, while transportation costs above 15% often indicate over-leveraging on vehicle purchases. The AI compares your actual percentages against these proven financial guidelines.
Category-specific benchmarks help identify improvement opportunities:
- Groceries: 10-15% of net income
- Entertainment: 5-10% of net income
- Personal care: 2-4% of net income
- Clothing: 3-5% of net income
Geographic adjustments ensure fair comparisons – your $4,000 rent in San Francisco gets benchmarked differently than the same amount in Kansas City. The tool considers local cost-of-living variations while maintaining universal financial health principles.
Review outlier categories where you significantly exceed optimal ranges. These represent your biggest opportunities for budget reallocation without dramatically impacting lifestyle quality.
Build Your Data-Driven 2026 Budget Blueprint

Set realistic targets based on proven patterns
Your spending analysis reveals exactly what you actually spend money on, not what you think you spend. Use these real numbers as your foundation. If your AI analysis shows you spent an average of $450 monthly on groceries over three months, don’t suddenly budget $200 because you think you should eat cheaper. Start with $450 and work from there.
Look for the 80/20 rule in your data. Most people find that 20% of their spending categories account for 80% of their total expenses. Focus your budget adjustments on these high-impact areas first. If housing, transportation, and food make up 75% of your spending, small improvements in these categories create bigger results than cutting your $15 monthly streaming subscriptions.
Your patterns also show your natural spending rhythms. Maybe you spend more in the first week after payday and tighten up toward month-end. Build this reality into your budget rather than fighting against it. Create weekly spending targets that mirror your natural flow.
Create automatic adjustment triggers for overspending
Smart budgets bend without breaking. Set up clear triggers that activate when spending exceeds your targets by specific amounts. For example, if you go over your dining budget by $50, automatically reduce discretionary spending by $25 for the next two weeks.
Create a three-tier response system:
- Yellow alert (10-20% over budget): Cut non-essential purchases for one week
- Orange alert (20-35% over budget): Freeze discretionary spending and meal prep more
- Red alert (35%+ over budget): Activate emergency protocols like using cash-only for the remainder of the month
Your AI analysis identifies which categories you consistently overspend in. These aren’t moral failures—they’re planning opportunities. If you overspend on groceries every month, your trigger might be switching to a detailed shopping list and avoiding certain stores when you hit 75% of your monthly grocery budget.
Plan for irregular expenses using historical data
Your three-month analysis captures some irregular expenses, but you need to think bigger. Create a comprehensive list of annual irregular expenses: car maintenance, gifts, property taxes, insurance premiums, medical expenses, and home repairs.
Use your historical data to estimate these costs. If you spent $800 on car repairs in the past three months, you might face $3,200 annually in vehicle maintenance. Don’t hope for the best—plan for reality.
Set up separate savings buckets for major irregular expense categories:
| Expense Category | Monthly Savings | Annual Need |
|---|---|---|
| Car Maintenance | $200 | $2,400 |
| Home Repairs | $150 | $1,800 |
| Medical/Dental | $100 | $1,200 |
| Gifts/Holidays | $125 | $1,500 |
Start funding these buckets immediately. When irregular expenses hit, you’re prepared instead of stressed.
Establish emergency fund requirements from actual needs
Generic advice tells you to save 3-6 months of expenses, but your AI analysis reveals your actual expense patterns. Calculate your true monthly survival needs based on what you actually spend, not theoretical minimums.
Strip your spending down to absolute essentials: housing, utilities, minimum food costs, transportation, insurance, and debt payments. Your analysis shows these real numbers. Maybe your total monthly expenses are $4,200, but your survival expenses are only $2,800.
Your emergency fund target depends on your income stability and expense flexibility. If you’re a freelancer with variable income, aim for 6-8 months of survival expenses. If you have stable employment and flexible spending, 3-4 months might suffice.
Build your emergency fund in phases. Start with $1,000 for immediate crises, then work toward one month of survival expenses, then three months, and so on. Your AI analysis helps you see exactly how long your current savings would last at your actual spending rate, giving you a realistic timeline for building adequate protection.

Taking control of your 2026 budget doesn’t have to feel like throwing darts in the dark. The AI budget analysis tool gives you the power to turn your past spending habits into a crystal-clear roadmap for the year ahead. By analyzing your last three months of transactions, you get real insights instead of rough estimates based on outdated budgeting methods that never quite capture your actual lifestyle.
Your spending patterns tell a story, and this free tool helps you read between the lines. Once you decode those results and build your data-driven budget blueprint, you’ll finally have a financial plan that actually works with your life, not against it. Stop second-guessing where your money goes and start making informed decisions that move you closer to your financial goals. Your future self will thank you for ditching the guesswork and embracing the clarity that comes with smart, AI-powered budgeting.